A collection of projects focused on data manipulation and visualization.
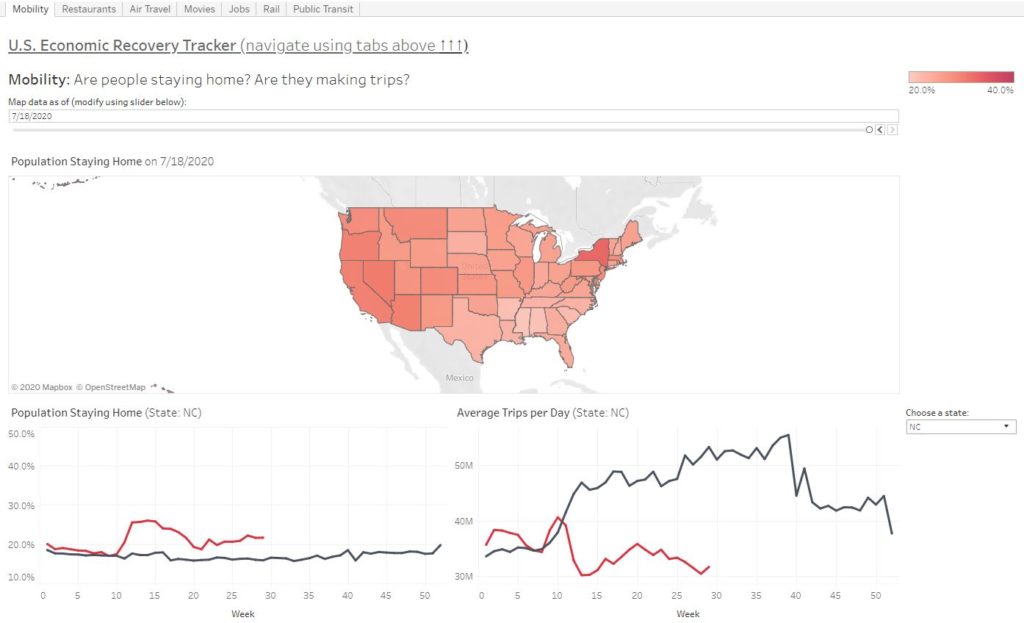
U.S. Economic Recovery Dashboard

This Tableau dashboard gauges the U.S. economic recovery in the aftermath of the COVID-19 pandemic by tracking high frequency (daily and monthly) data, updated weekly.
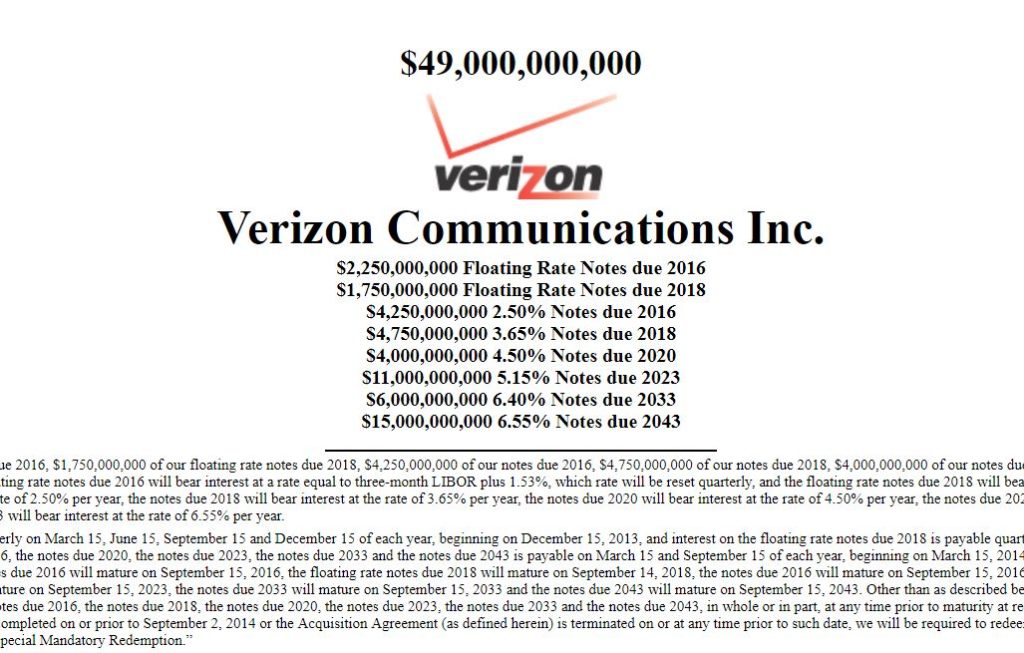
Dataset: Bond Issuance

Around 5000 bond and preferred stock issuances for approximately 800 companies, dating back to 2004. Created via interpreting SEC filings using Python. Available in Excel and as a SQLite database.
Charlotte Rent Scraper

While apartment hunting in Charlotte, NC, I built a web scraper to continuously keep track of rent prices for various apartments. A less stressful way to pick a new home.
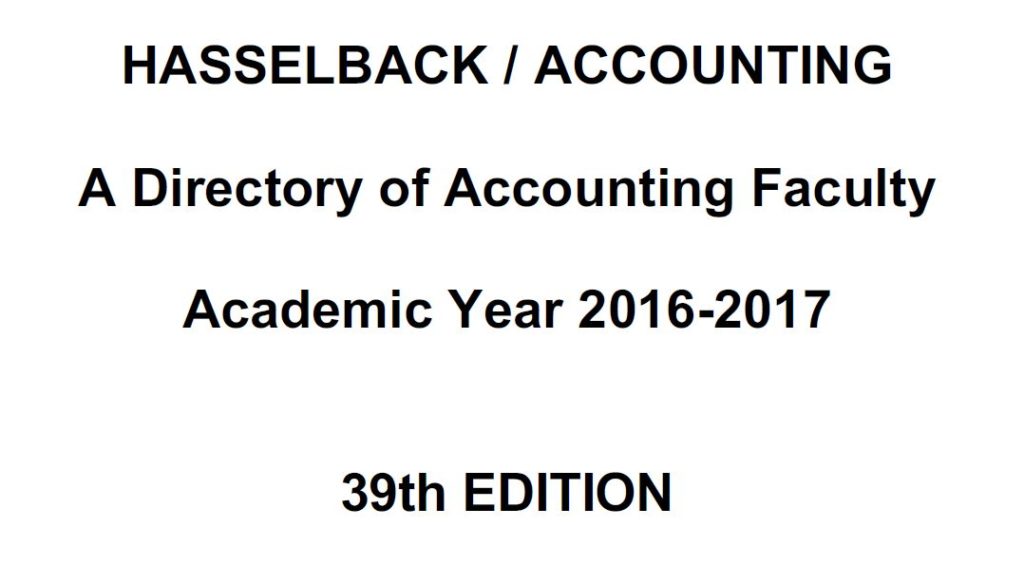
Hasselback XL

The publicly available Hasselback Accounting Directories list the names, ranks, schools, degrees, and other information for accounting faculty in the US and worldwide, going back several years. I have written a Python script to transcribe the data from PDF files into Excel, bypassing the $1,800 paywall.